This blog post is an adapted version of my paper submitted as coursework during the 2017/2018 school session for my BSc degree. This blog post is also an extension of the blog post linked below:
https://abdulhazim.wordpress.com/2018/09/30/foraging-reflex-agent-with-pseudo-deliberation-using-utility-functions/
Here, I was expected to build a Multi-Agent system that is based on the Single-Agent system built before. The core objective was to understand coordination in Multi-Agent systems.
This post will start off with a description of the task environment which is then followed by the design of the agent and the design of the fleet. The fleet is the collection of all agents working in the task environment, it also includes the coordination method design. It will then end with the discussion on the performance of the agent.
The Task Environment
The task environment can be abstractly defined as a simulation on a 2D plane populated by Cells and there are 4 types of Cells which are Empty, Station, Well and Fuel Pump. The 2D plane is inherently populated by Empty Cells with a random distribution of Stations, Wells and Fuel Pumps and the Tanks are the active entities and it is to be controlled by a Software Agent. Each Tank is controlled a copy of the Software Agent so every Tank behaves independently which is why Coordination methods are required to produce an efficient Multi-Agent system.
Additionally, there is a Fuel Pump always available at the origin (0,0) of the 2D plane. Also, the Tank can move in 8 directions on this plane which are North, South, East, West, North-East, North-West, South-East and South-West.
The task in this environment are controlled by Stations, they produce waste periodically that the Tank is meant to pick up and dispose at a Well. The Tank can only hold a maximum of 1000 waste and each movement consumes 1 fuel. The Fuel Pumps are refuelling points and movement actions can fail with a small probability of 0.0015. The Tank also can only see the environment in a square radius of 20 Cells.
The performance measure of an agent in this task environment is defined by the amount of waste a Tank can collect within a set duration of 10000 timesteps. The efficiency of the system is measured by dividing the sum of the performance measures by the number of agents.
Design of Agent
The design of the Agent is exactly the same as the one described in the previous blog post, the link of which can be found below:
https://abdulhazim.wordpress.com/2018/09/30/foraging-reflex-agent-with-pseudo-deliberation-using-utility-functions/
Design of Fleet
Besides coordination methods, the number of agents in the fleet and exploration policies are also variables that could be tinkered with to obtain an optimal multi-agent system. Those variables will also be touched upon in this article.
Firstly, a controlled fleet needs to be established. So, the simulation is ran using 4 agents in the fleet without any changes to the exploration policy and no coordination methods implemented. The paths of the agent are plotted in Diagram 1 below.
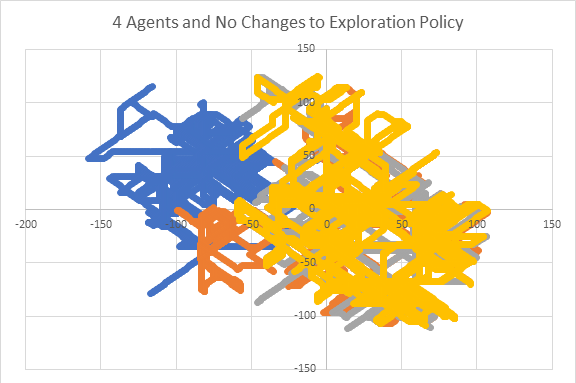
[Diagram 1: The path of agents when a fleet of 4 agents were used with no changes to exploration policy. Additionally, there was no coordination method implemented]
Exploration Policy
Next, the exploration policy was altered. An exploration policy named Incremental Exploration was developed. For instance, let the sequence of exploration directions be {0, 1, 2, 3, 4, 5, 6, 7}. To find the actual direction in the task environment, refer Diagram 2 below.
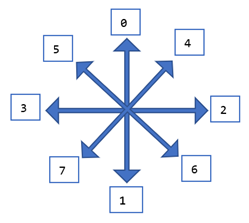
[Diagram 2: The map of directions and their corresponding indexes]
Incremental Exploration policy rotates the starting exploration direction with every new agent introduced into the simulation. For example, the first agent would explore direction 0, the second agent would explore direction 1 and the third agent would explore direction 2. Incremental Exploration policy brought new fleet behaviour in terms of path taken and it can be seen in Diagram 3.
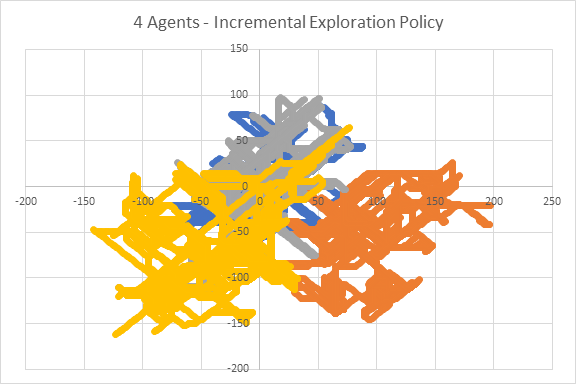
[Diagram 3: The path of agents when a fleet of 4 agents were used with Incremental Exploration policy. However, there was no coordination method implemented]
If we try to distinguish the territories of agents by using the path taken by them, it can be observed that there are 3 clusters or regions. The gold path is one cluster to the bottom left of coordinate (0, 0), the orange path is a cluster to the bottom right of the coordinate (0, 0) and finally blue and grey are sharing a region. The sharing of region is what should be avoided as it can contribute to competition. For a multi-agent foraging system to be efficient there needs to be minimal competition.
When a new trial is performed with only 3 agents instead of 4, new behaviour of the fleet is spotted. The path taken by agents can be seen in Diagram 4. Here, it can be seen that there is better separation of regions which reduces potential competition. Therefore, a fleet of 3 agents will be built.
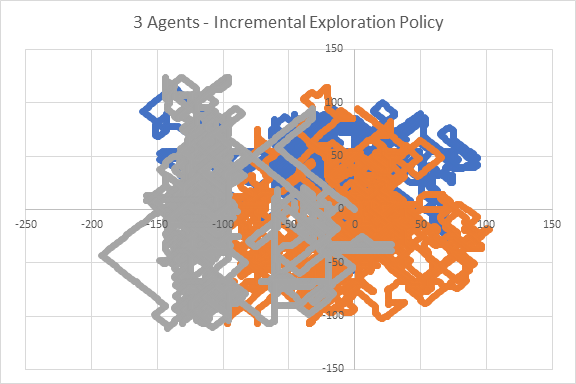
[Diagram 4: The path of agents when a fleet of 3 agents was used with Incremental Exploration policy. However. no coordination method was implemented]
Next, the sequence of exploration must be revised since there is a change in the number of agents in the fleet. An optimised sequence would be a sequence that ensures agents move away from each other at an equidistant angle. It will also need to be a sequence that ensures agents backtracks in direction perpendicular to the current direction. This ensures that the agent explores the area thoroughly instead of going too far away from the origin. Once again, we see a difference in the fleet’s behaviour and it is demonstrated in Diagram 5. The chosen direction sequence is {0, 6, 3, 4, 1, 5, 2, 7}.
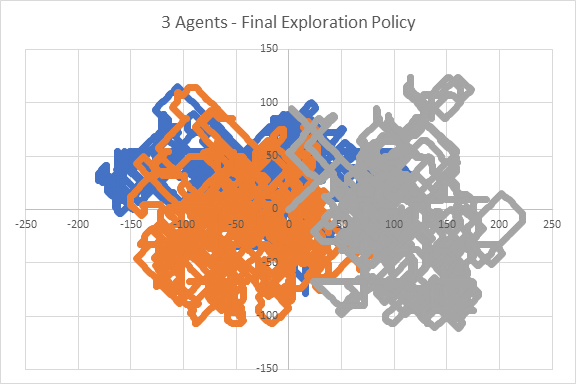
[Diagram 5: The path of agents when a fleet of 3 agents was used with Incremental Exploration policy with tweaks to the exploration direction sequence. However, no coordination method was implemented]
Cooperation and Coordination
Two coordination methods are explored here which can be labelled as active coordination and passive coordination.
The active coordination takes a centralised approach such that whenever an agent is deciding to get waste from a station, it will query other agents of the utility function value they obtained. If another agent has a higher utility function value for that station, this agent would simply ignore the station. This approach is inspired by contract net and uses more computational resources but would ensure a more reliable and effective coordination method especially when there is a large fleet with a dense distribution of agents. This approach would also be easily verifiable.
The passive coordination method takes a decentralised approach such that whenever an agent calculates the utility function value of a station, it will scan the surrounding area of that station for other agents. If it sees another agent is moving towards the station, it would ignore that station to allow the other agent to carry on with the task. This method would use less computational resources but would not be as easily verifiable which also means that it may not be as reliable. This method would work best in small fleets with a sparse distribution of agents. Hypothetically, passive coordination would be a better choice in the fleet implemented here of 3 agents.
Results and Discussion
The agent program was evaluated by running it 50 times in random environments. The final score is noted down together with its coverage which is percentage of waste collected from the waste generated by the simulator. The table below shows the average scores and score ranges. Average score is the total waste collected by the fleet divided by the number of agents in the fleet which was 3. The score range is the difference between the maximum individual agent score and the minimum individual agent score.
| Coordination Method |
Average Score |
Score Range |
| No Coordination |
88618.28 |
81573 |
| Active |
87896.1 |
74046 |
| Passive |
85143.68 |
59088 |
The table below shows the coverage which is the ratio of collected waste to generated waste.
| Coordination Method |
Average Coverage |
Coverage Range |
| No Coordination |
0.78029 |
0.176092 |
| Active |
0.782282 |
0.173866 |
| Passive |
0.773074 |
0.240428 |
Based on the results, it cannot be concluded that one coordination method is better than the other. However, it was certainly interesting to see the range of the average score decrease when coordination methods were implemented.